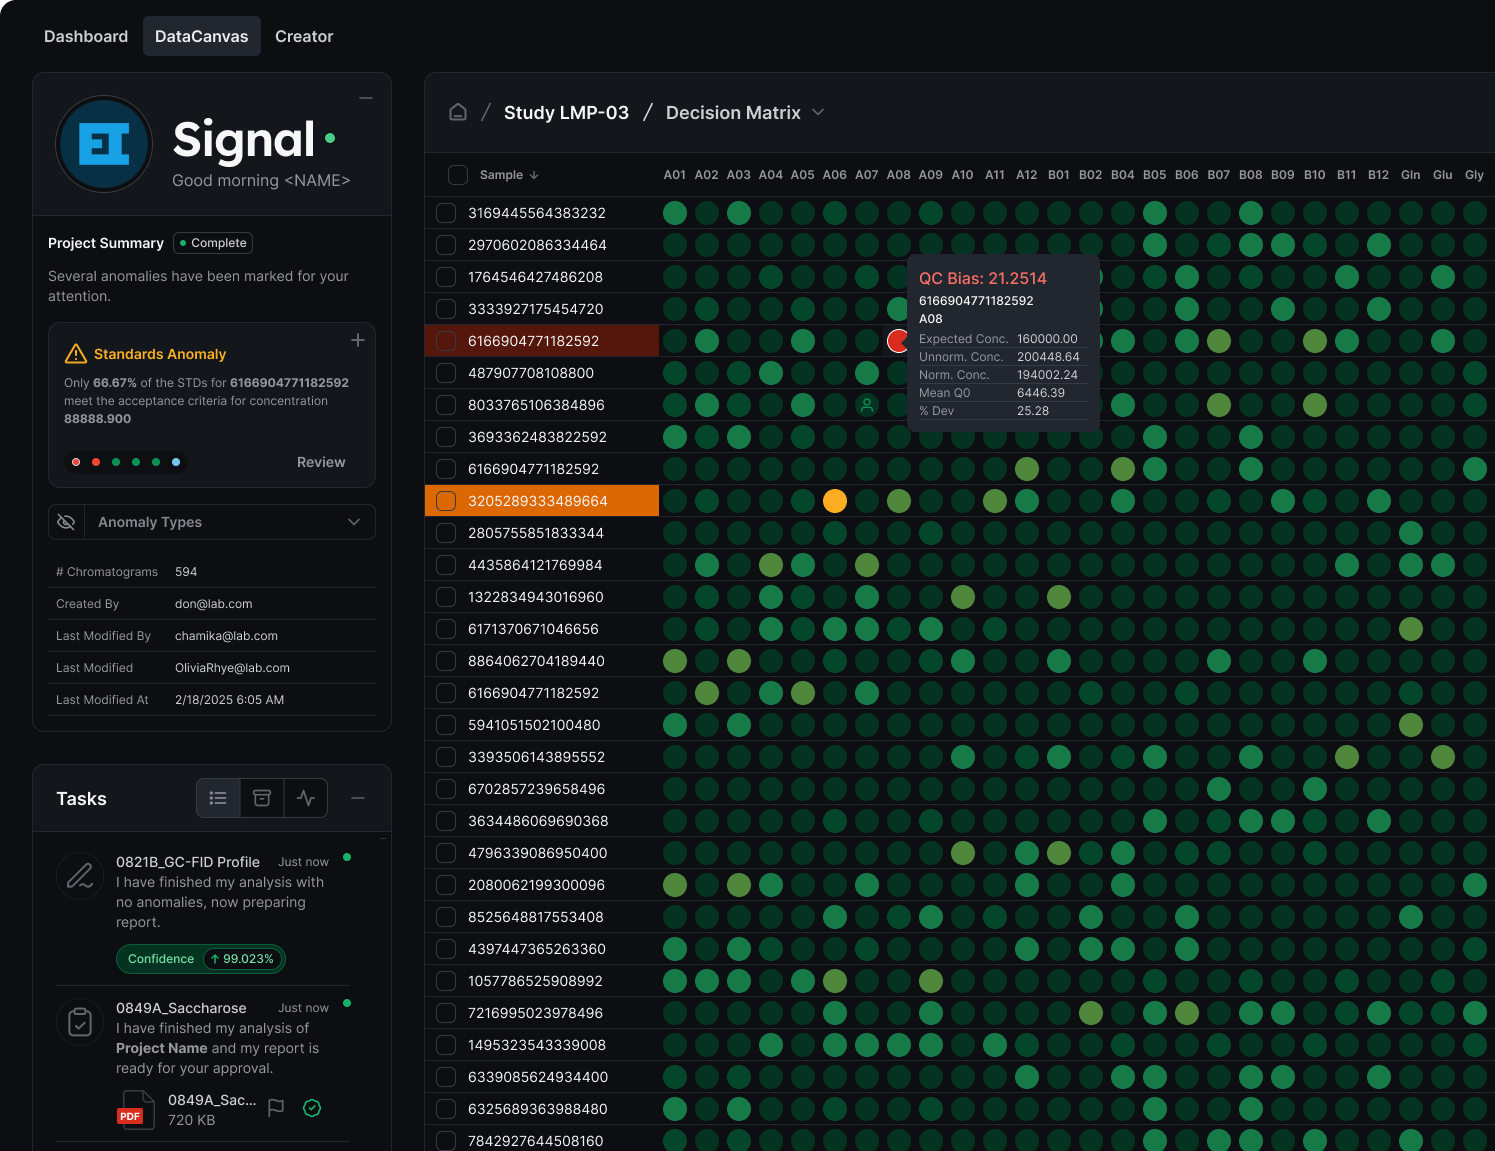
What changed before the result did?
A result shifts. Was it the instrument, the sample, or a meaningful change in the study? EI Signal connects evidence across the data your labs already produce, so you know which one it was, early enough to change every decision that follows.
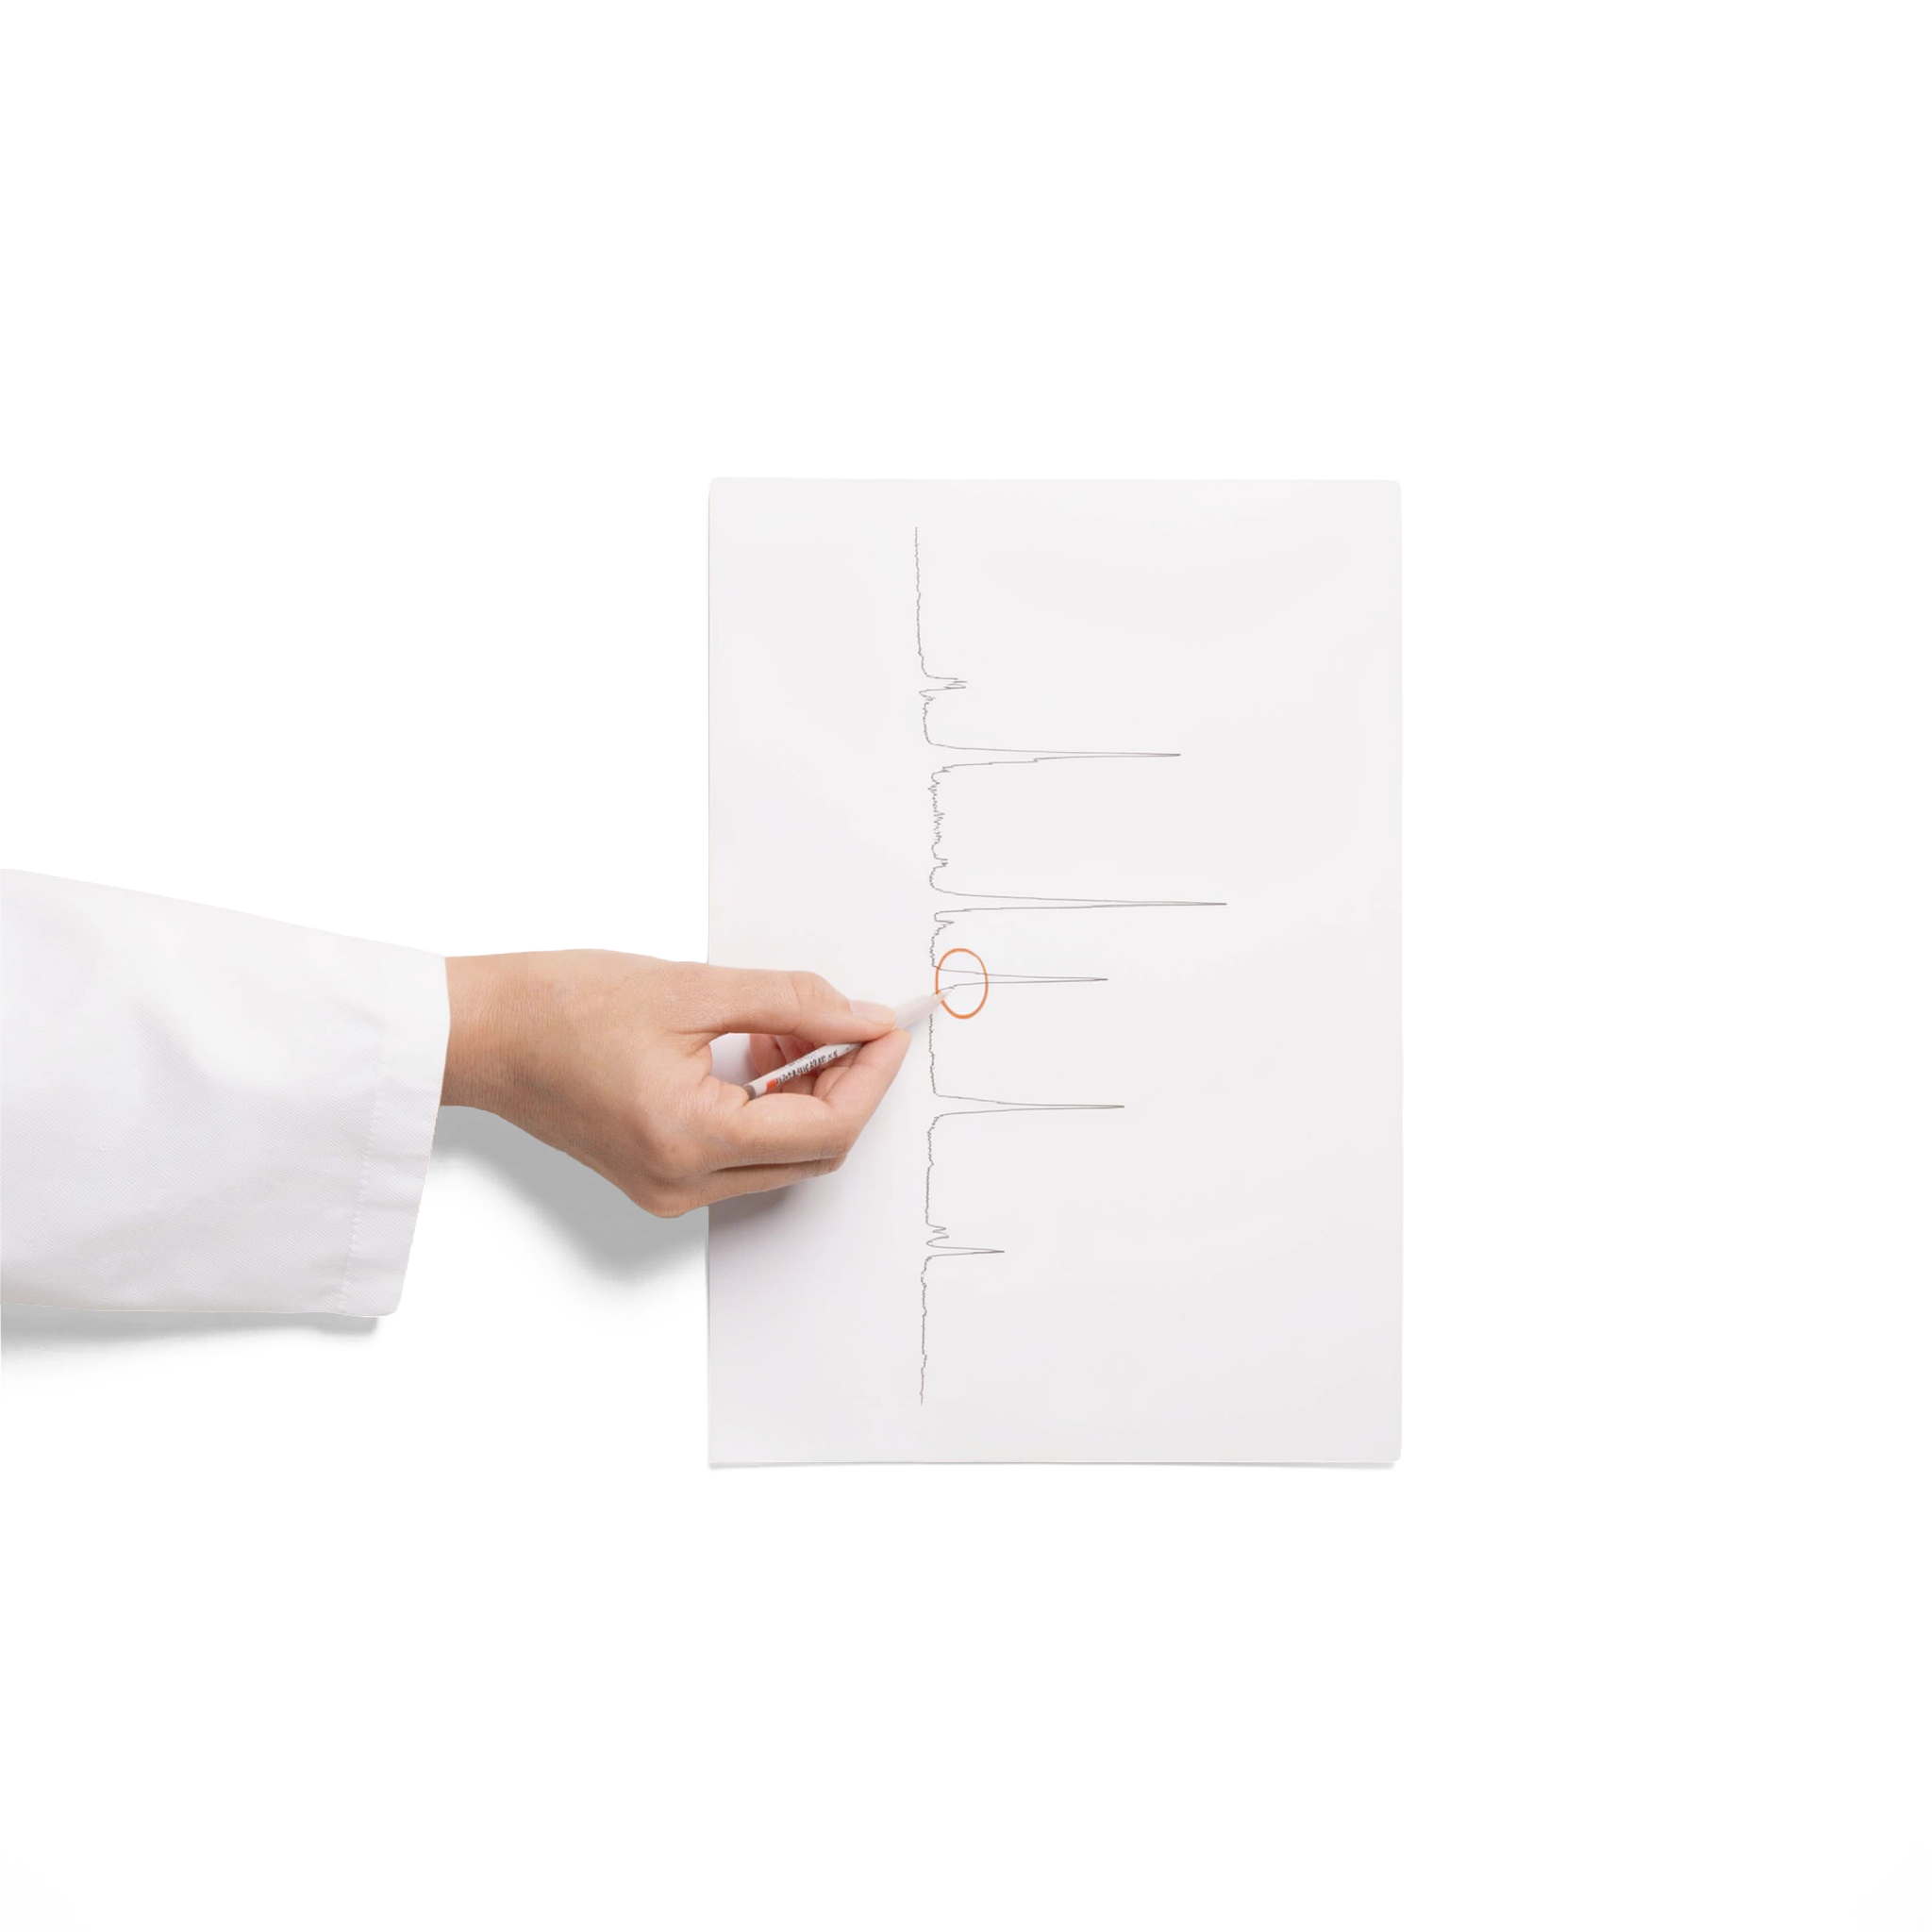
Build the understanding your decisions require.
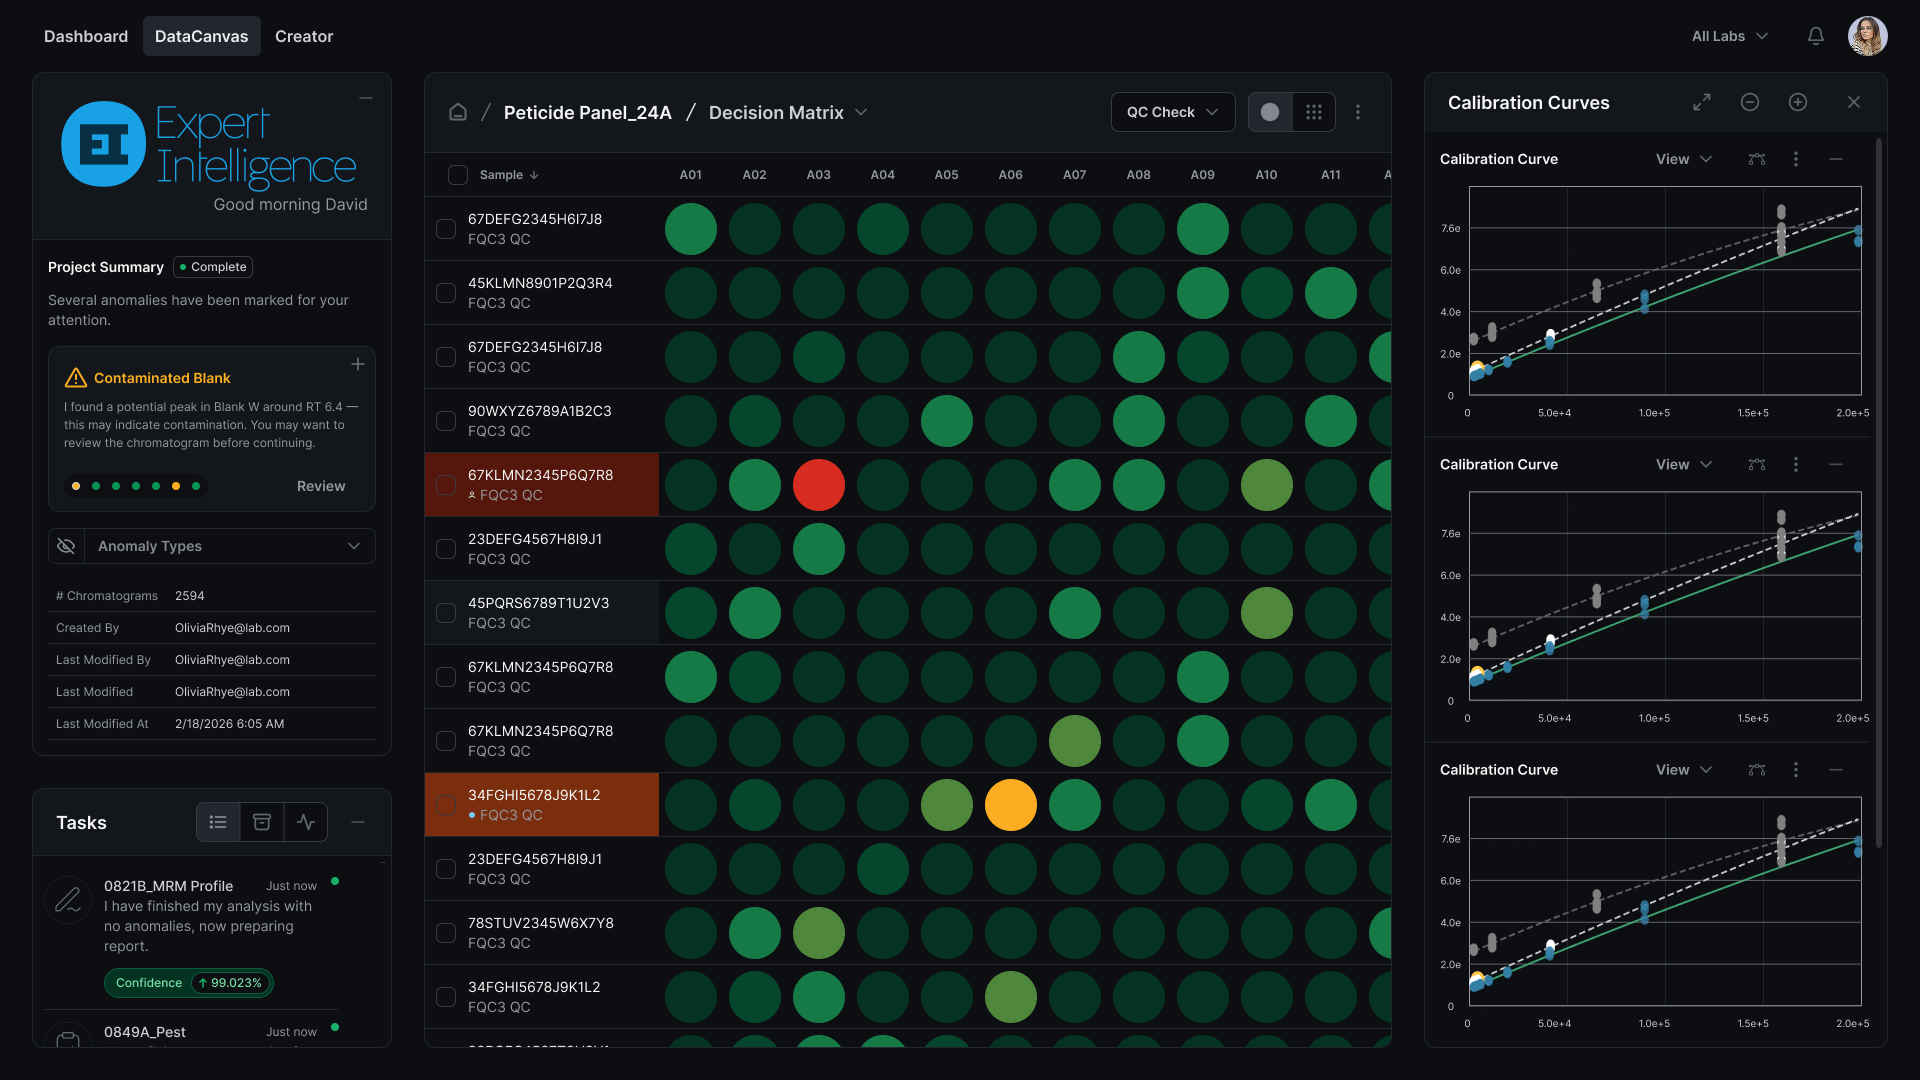
Understand what no single method can show.
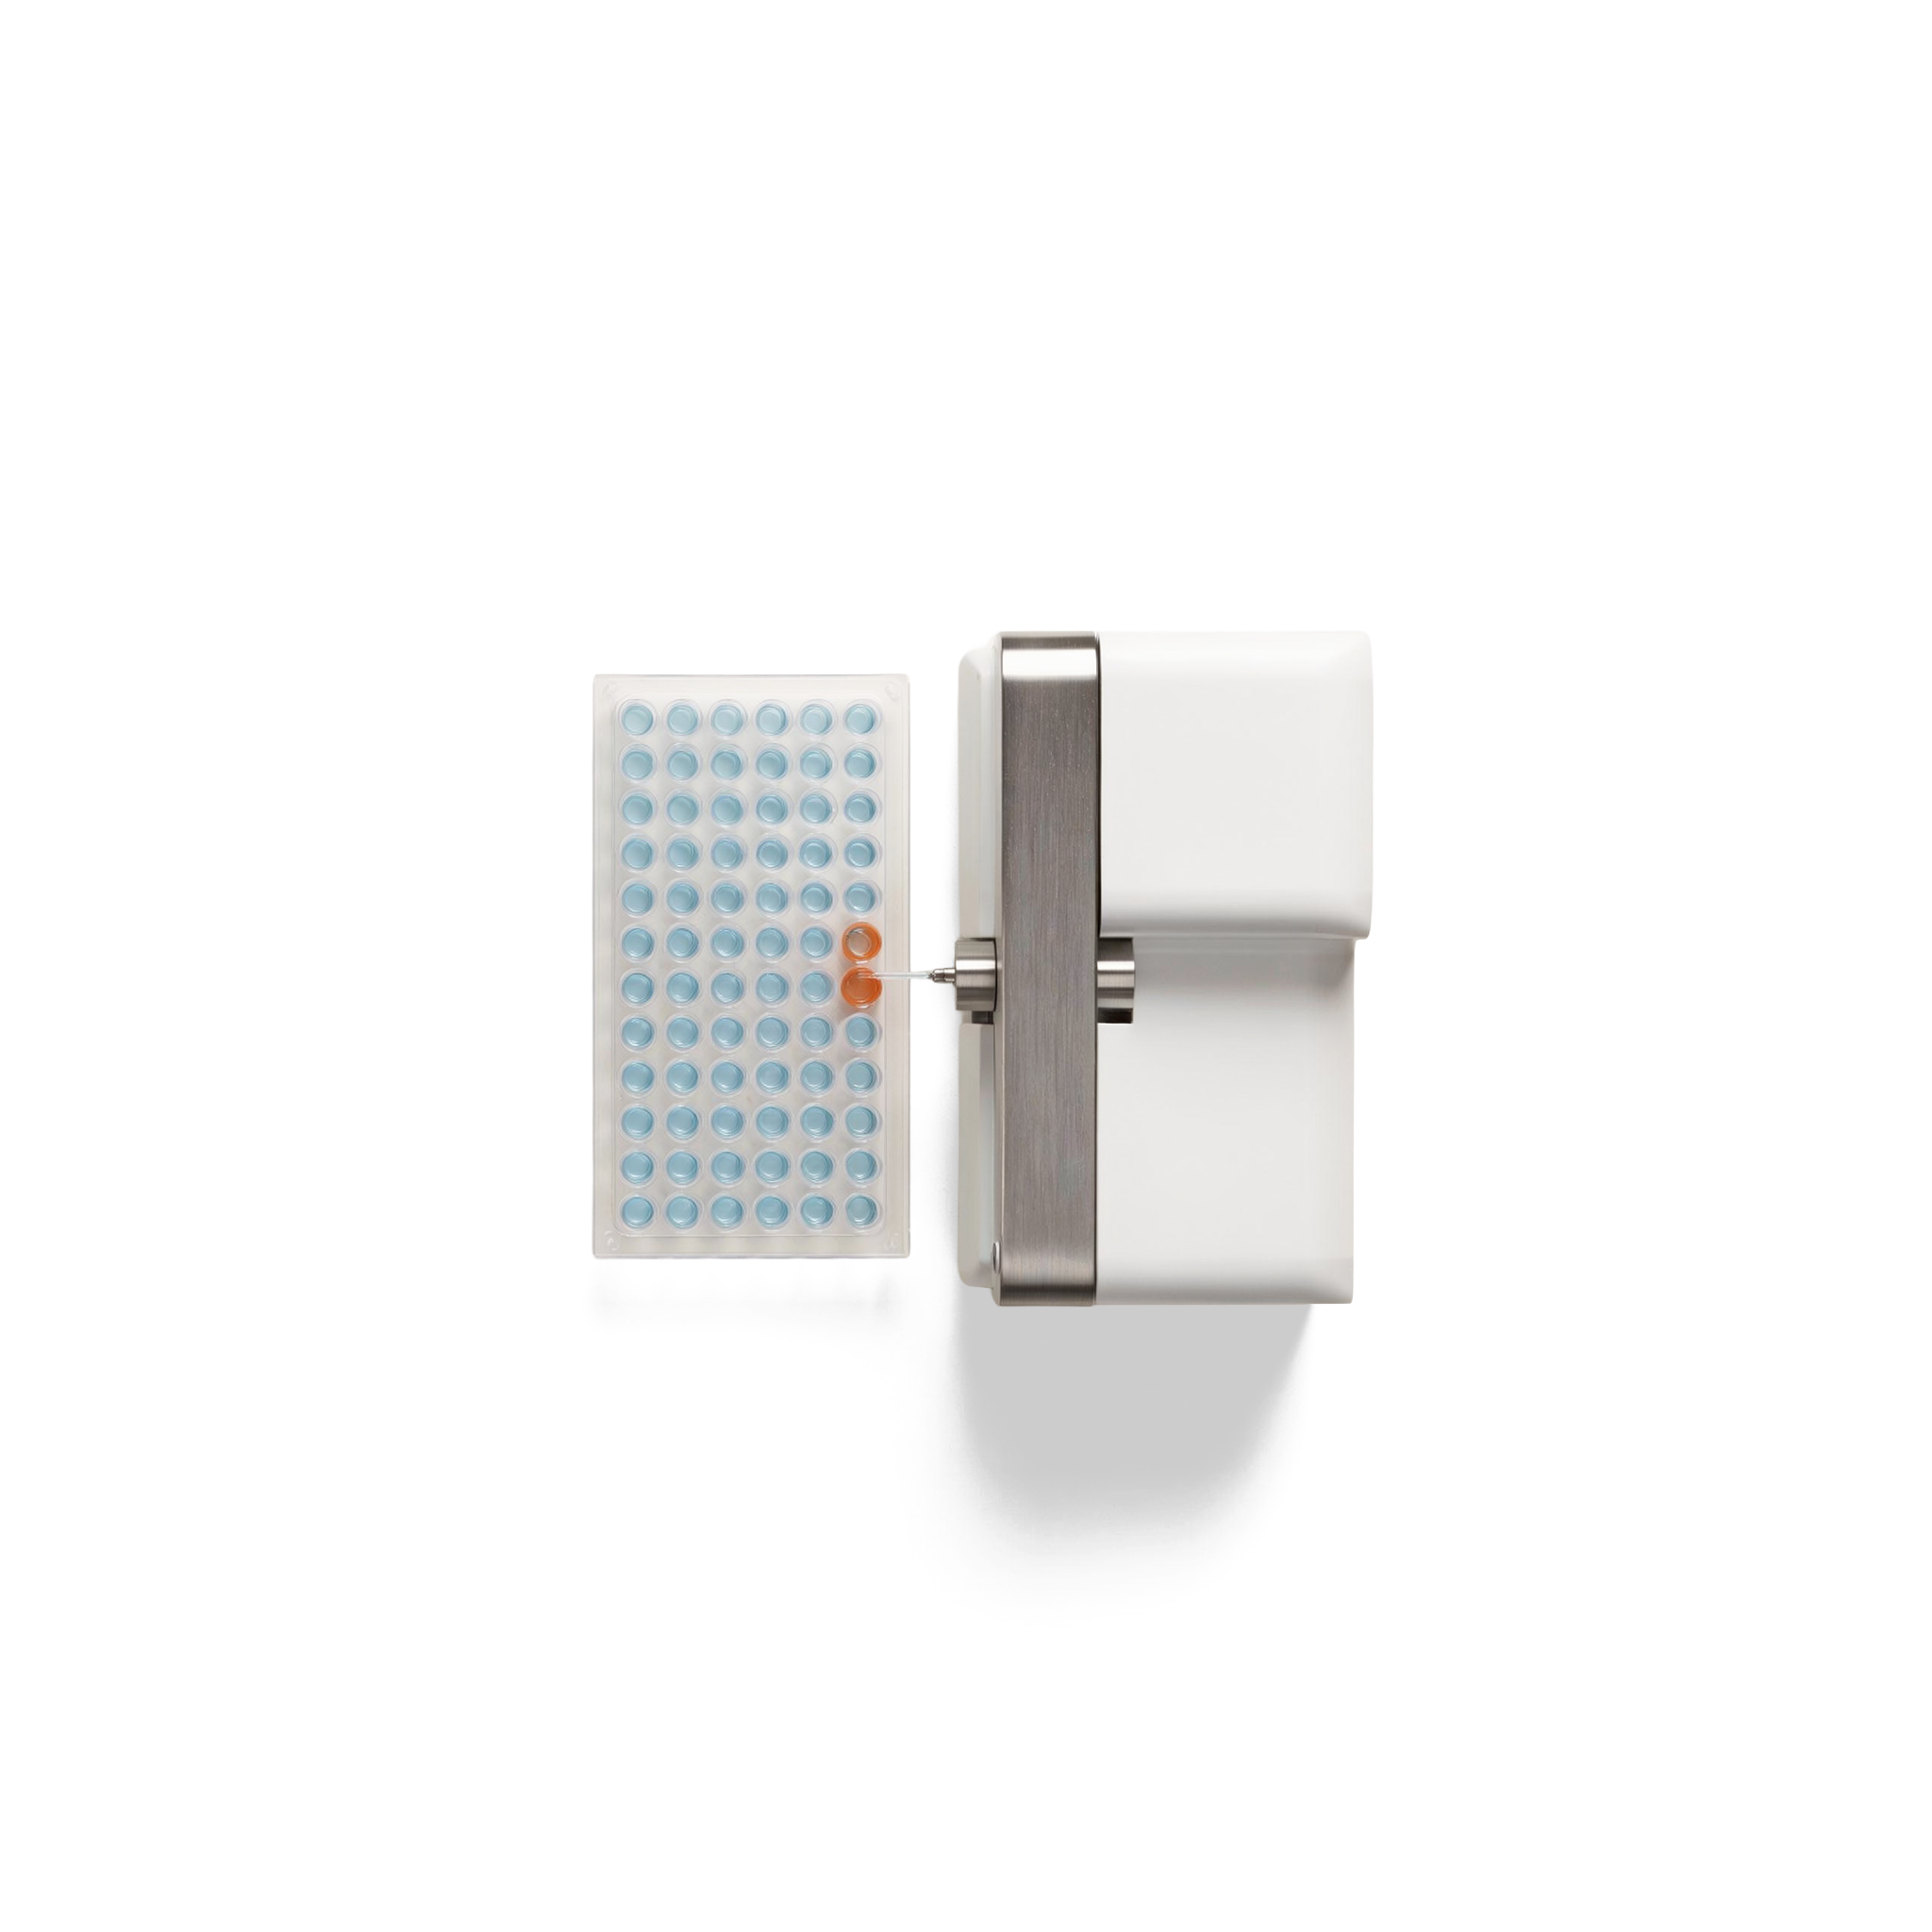
EI Signal combines data from multiple analytical methods into a unified, multimodal understanding, connecting evidence that was previously too complex to interpret together. You gain a richer, more complete picture from data your labs already produce.
Reveal where
complex data is heading.
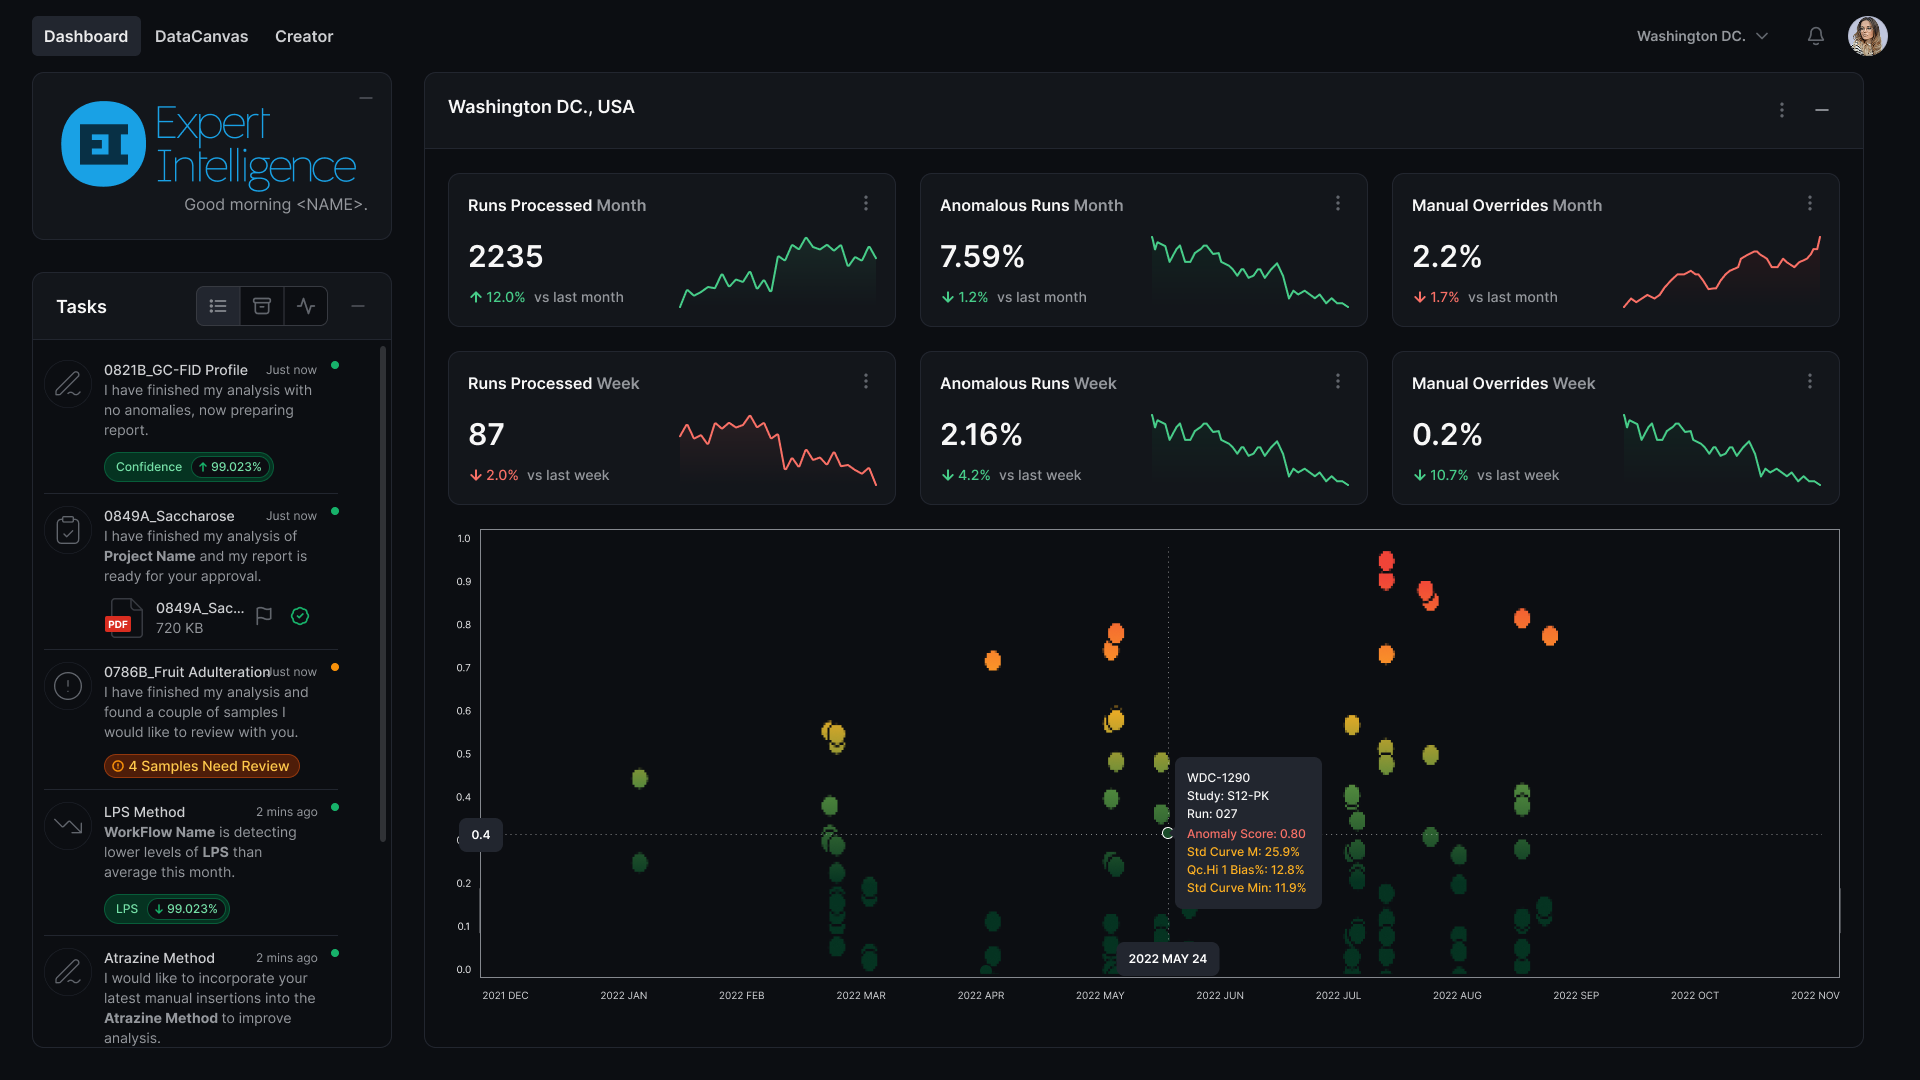
EI Signal can process hundreds of thousands of data points across time or any defined dimension. It surfaces patterns, projects where an observed trend is heading, and alerts scientists while there is still time to act.
Know when “normal”
begins to shift.
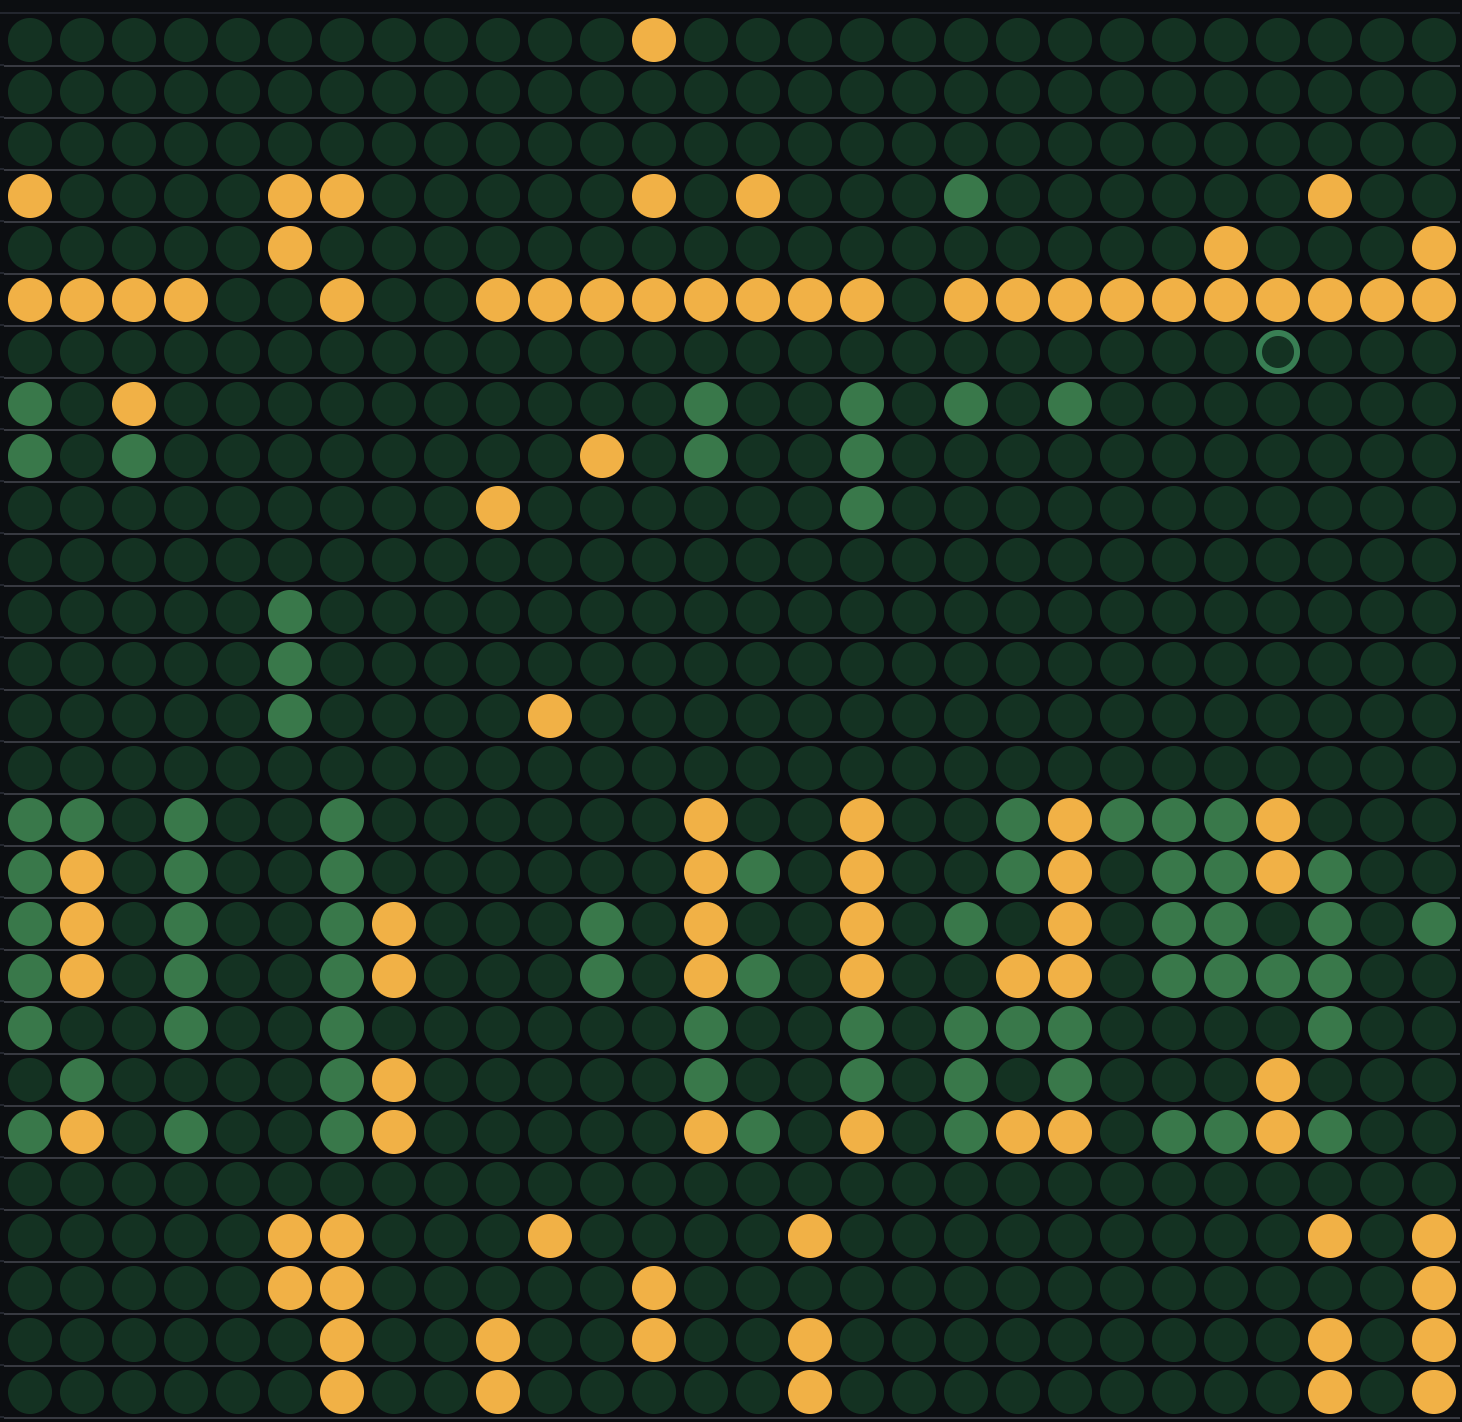
EI Signal learns the highly dimensional relationships that define expected behavior across a product, workflow, instrument, or lab. It detects when those relationships begin to drift, even while individual results remain within accepted limits.
Where EI Signal goes to work.
These are a few ways EI Signal is being used to answer questions that were previously difficult or impossible to answer.
Method and system suitability over time.
EI Signal follows suitability metrics and controls across every run, rather than checking them one at a time. It identifies slow method drift that passes each individual check but becomes clear over weeks, before it threatens a result you have to defend.
Product fingerprint across development.
EI Signal combines many tests and modalities into one product signature, then follows it as the molecule and process evolve across development, lots, scale-up, and site changes. It reveals when the combined signature shifts even while every test remains in spec and preserves an analytical lineage of what changed and what remained consistent.
Studies over time.
EI Signal follows the full dataset of a long-running study from first result to final report. It reveals emerging risk early enough to investigate and act before it compromises the study, triggers an OOS investigation or deviation, or delays a filing.
Workflow and lab health.
Across a fleet of instruments, EI Signal connects instrument health with sample-preparation and pipetting performance, plate-washer behavior, reagent shifts, and assay plate and column life. By following how the entire lab behaves over time, it reveals interacting changes no single instrument or metric can show, giving teams time to correct them before they reduce throughput, create rework, or compromise data quality.
Your judgment, across the portfolio.
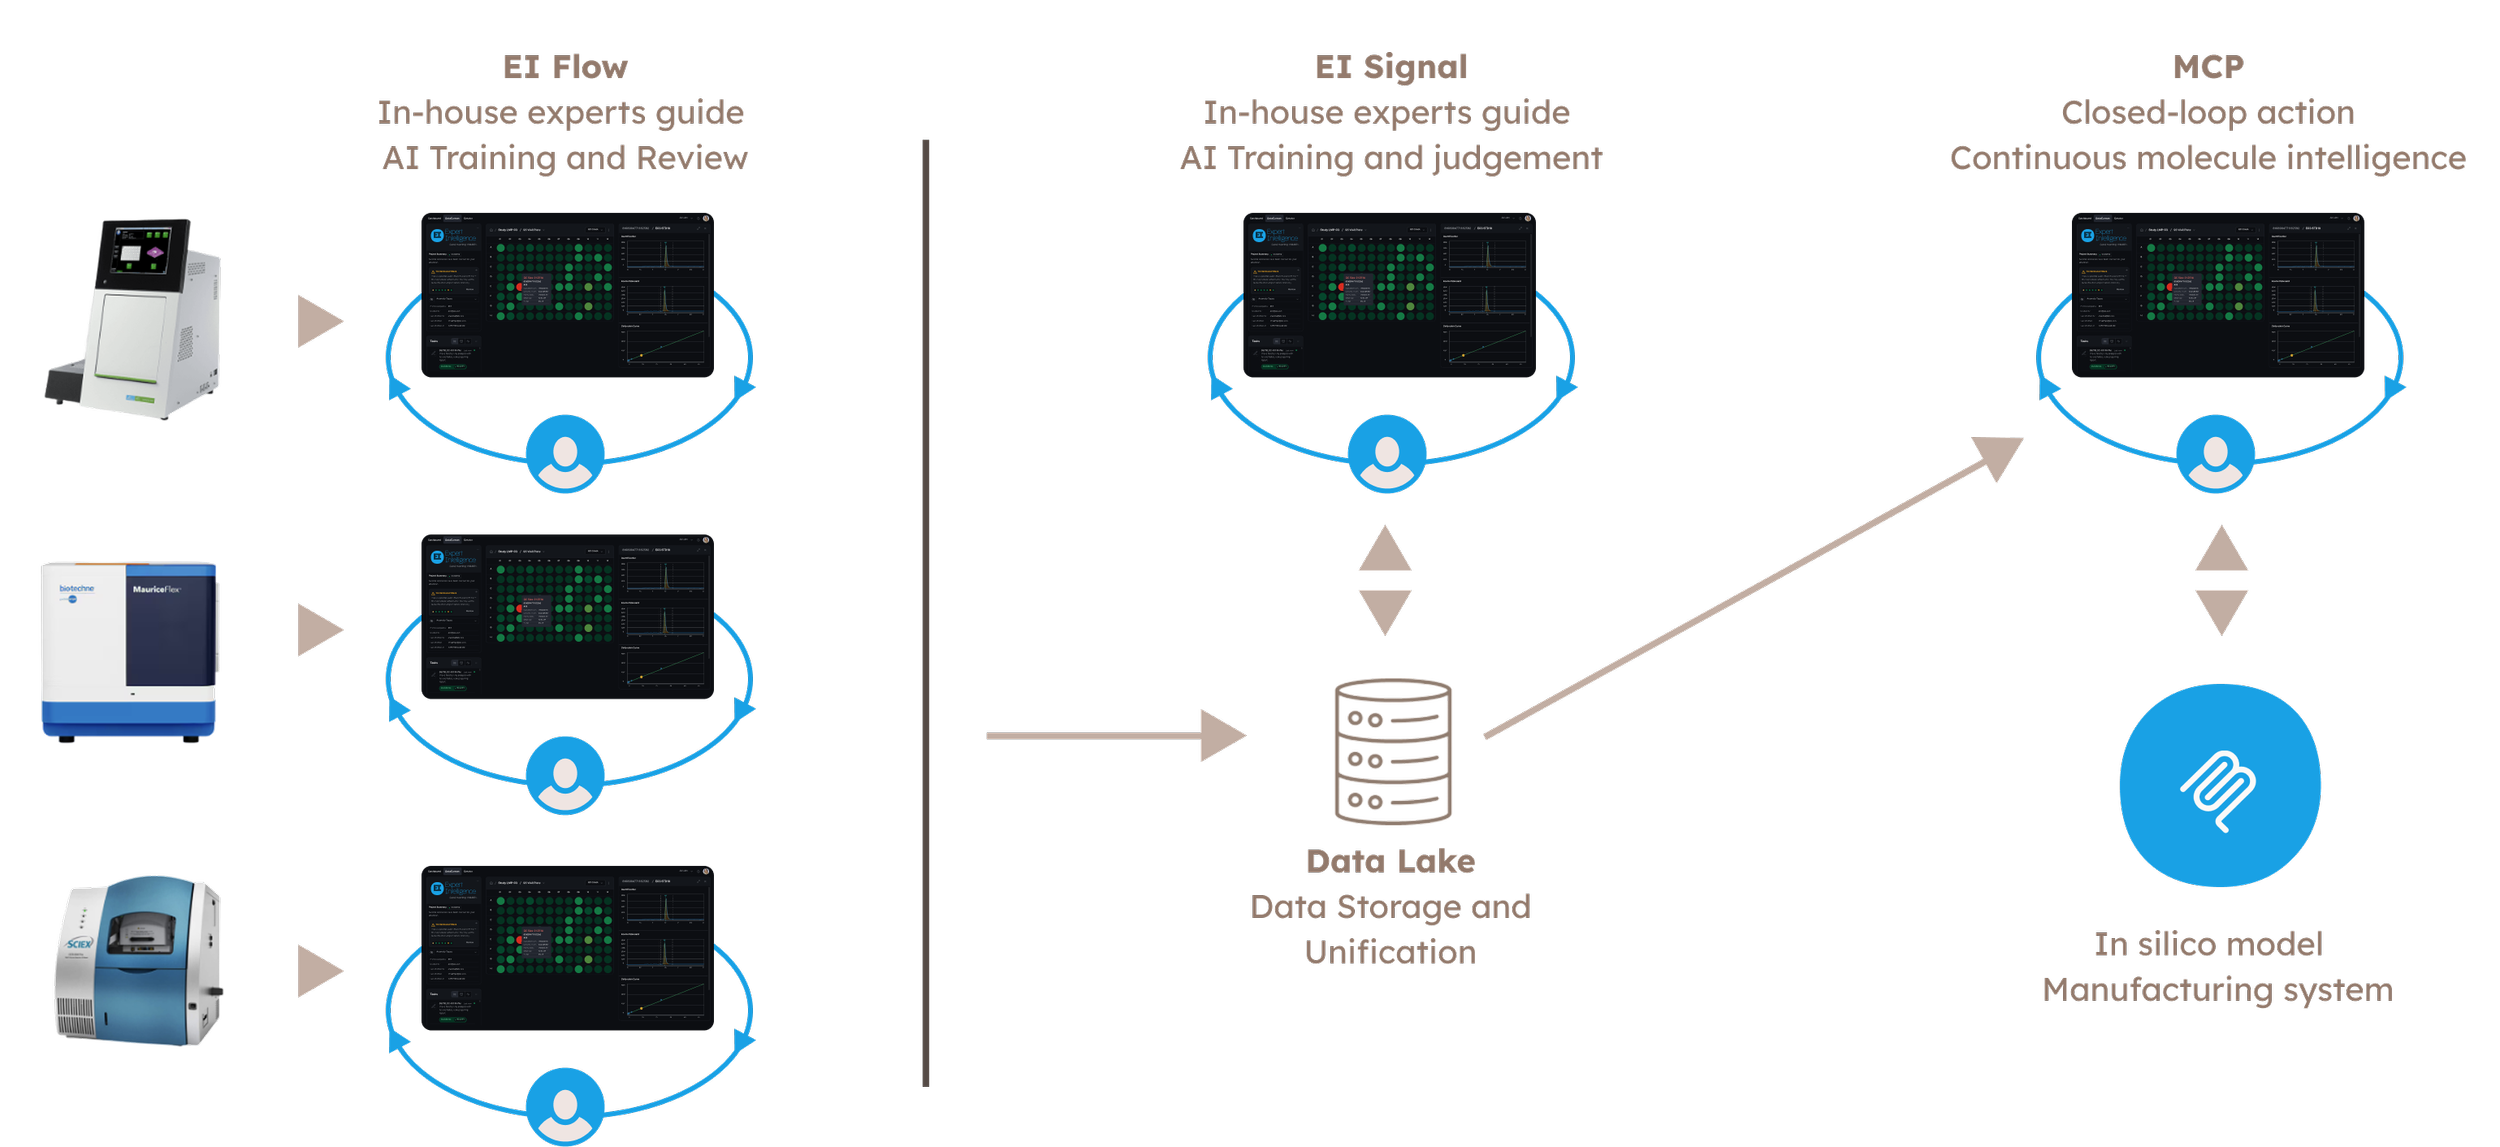
EI Signal turns governed laboratory evidence into connected understanding, then makes that intelligence available to the people, models, and systems authorized to use it. Every input remains traceable to instrument data or approved expert data, preserving the scientific record as intelligence moves across development.
Governed results.
EI Flow creates a continuous stream of governed, traceable decisions at the source. EI Signal connects those results while keeping their evidence, model version, confidence, and review intact. Approved analytical and expert data from other sources can enter through the same governed path.
Connected understanding.
EI Signal weaves governed evidence across time, methods, workflows, and labs into one intelligence layer. Relationships and change become visible without altering the underlying record.
Authorized action.
MCP makes that intelligence available to authorized scientists, models, and systems, from in silico design to manufacturing and quality. When those actions produce new laboratory results, EI reads that evidence through the same governed path, extending understanding over time.

Your thresholds. Your call.
Your scientists define what meaningful change means, who can see each signal, and what happens when a threshold is crossed. EI Signal keeps every flag traceable to its source data, confidence, and model version, preserving data integrity and making each decision defensible. It acts only within the responses you authorize.
“Every long-term study is now watched as it runs. We catch a trend forming and act months before it could become a warning letter...”
— Head of Quality, Global Pharmaceutical Company

Case Study
Case Study
Case Study
Frequently asked questions.
-
Scientists define the question and scale. EI Signal connects data from multiple analytical methods, processes complex datasets across scientist-defined dimensions, and learns highly dimensional patterns. It can be applied to an instrument, workflow, study, product, lab, organization, or partner network to reveal relationships and emerging change no individual result can show.
-
No. SPC monitors defined process measures using established control limits and rules. EI Signal extends that view by connecting data across variables, analytical methods, and timepoints to understand their relationships. It can reveal when the combined pattern changes even while each individual measure remains within its limits.
-
EI Signal learns the highly dimensional relationships that define expected behavior in your data. Scientists validate it against known data and define meaningful change for the intended use. Every flag remains connected to the data, pattern, confidence, scope, and model version behind it.
-
EI Signal is evaluated against the question it is configured to answer, rather than one universal accuracy percentage. Teams assess measures such as detection performance, confidence, useful lead time, false-alert rate, and projection performance before relying on it operationally.
-
EI Signal does not guess or fabricate a future state. It projects where an observed trend is heading based on real data and shows the evidence behind that projection. Your scientists define the thresholds and decide when and how to act.
-
Your scientists define meaningful change and authorize the response. EI Signal can flag a result, route it for review, or use MCP to trigger an approved action. Nothing happens outside the rules and permissions you establish.
-
Signals can be delivered through MCP to in silico design models upstream and manufacturing and quality systems downstream. When those actions produce new laboratory results, EI reads that governed evidence, extending understanding across development.
-
No. EI Signal can work directly with traceable instrument data, governed analytical results, and approved expert data. When the products are used together, EI Flow automates scientific review at the source, giving EI Signal a continuous stream of refined, traceable decisions while preserving the original record.
See it in action.
Request a demo and see how trusted results compress the time and cost of drug development.