Expert Intelligence
weaves the analytical fabric
of drug development.
Scale and accelerate every decision your scientists make with regulatory-grade accuracy, and connect them into one shared intelligence spanning the whole pipeline.
Analysis in Minutes,
Not Months
50×
Faster Throughput
Raw instrument data to signed, LIMS-ready output across every method and site.
High Accuracy,
Governed Decisions.
7×
Increased Accuracy
Exception-based review reduces decision variability and manual rework.
Lab Orchestration,
End to End.
10×
Faster Integration
One platform across fragmented instruments, software, and data.

Two Products, One System.
THE EI ECOSYSTEM
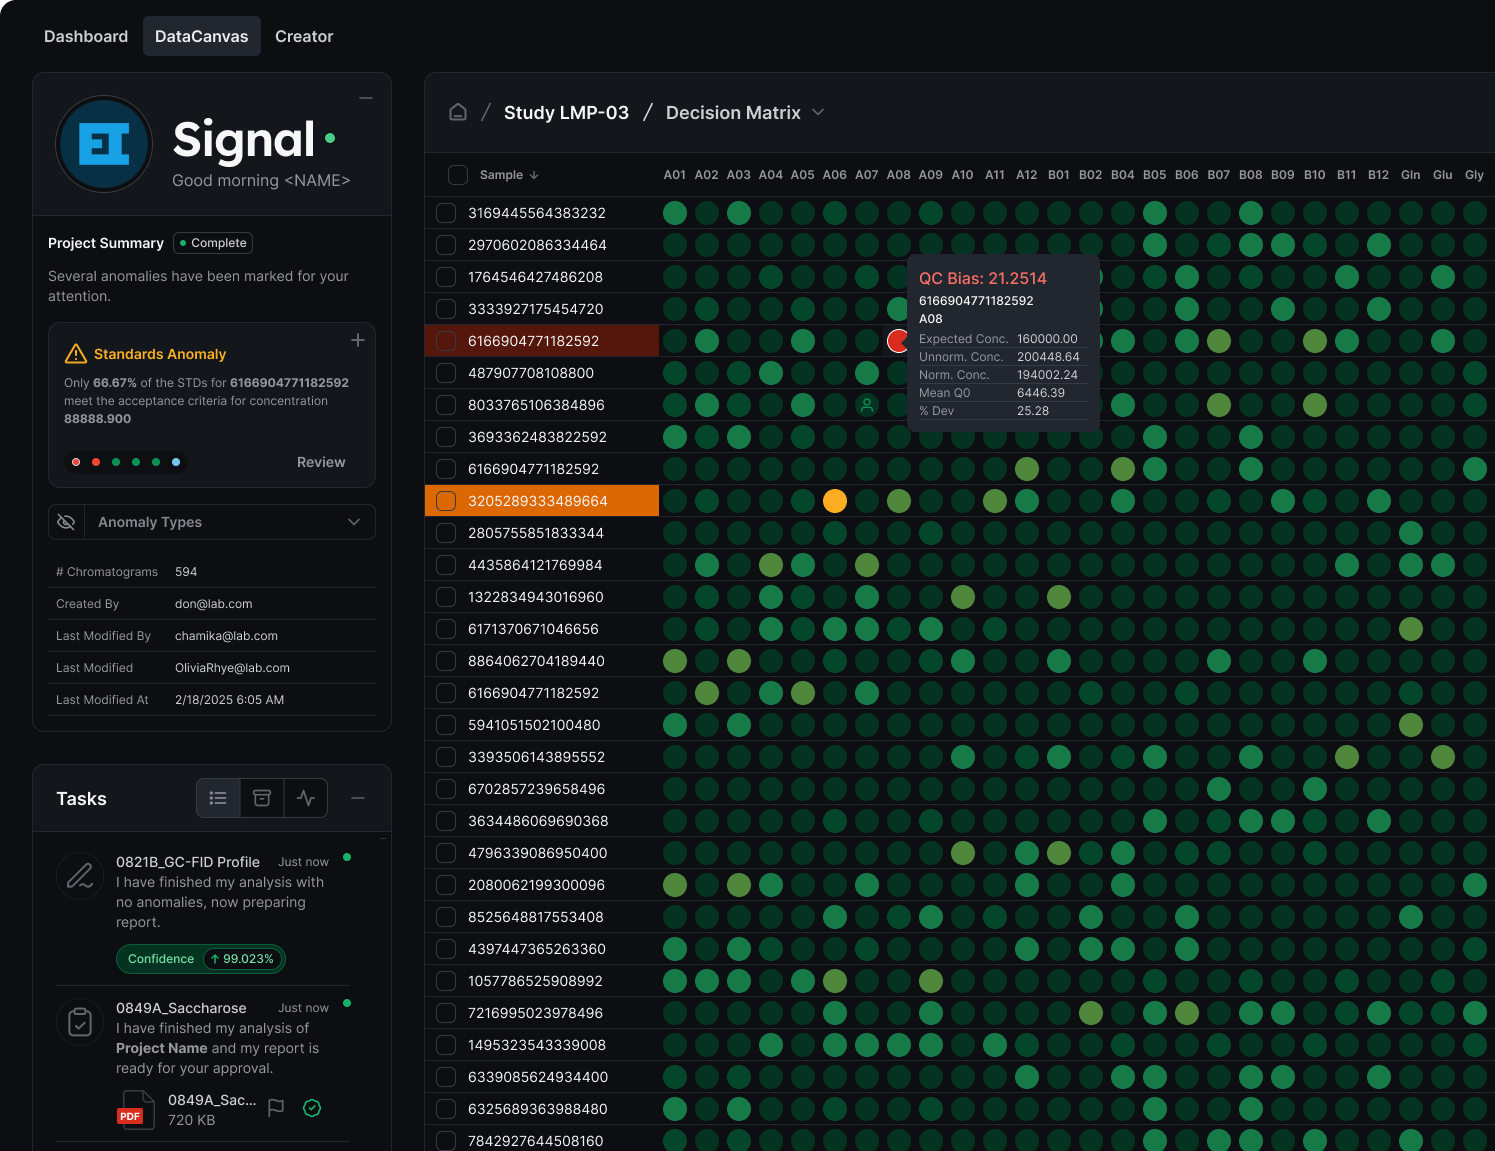
EI Flow automates in-batch results from instrument data to signed, explainable reports.
EI Signal reveals lab-wide trends across instruments, methods, and sites.
EI Flow
Make the call on every run
Turns raw instrument data into SOP-aware, signed, explainable results that reach your LIMS in minutes. Analysts review only exceptions.
Explore EI Flow
EI Signal
See the lab as a system
Unifies months to years of data across instruments, methods, and sites. Surfaces drift and out-of-trend results early, before they reach release.
Explore EI Signal

Move at the Speed of Discovery. Trust Every Result.
AI has made the front of drug development faster than ever. Validating those candidates hasn't kept up. Analytical decisions are still made by hand and siloed by stage, so the pipeline moves at the speed of its slowest handoff, and the AI tools meant to help can't be trusted in a regulated workflow.
Expert Intelligence weaves analytical decisions into one fabric across the pipeline. It scales and accelerates every decision with regulatory-grade accuracy. Connects them from discovery to manufacturing, and flags risk before it reaches release, scientist-trained, signed, and never hallucinated. Your programs move faster, and every result holds up.
Quick answers for anyone exploring EI
FAQ
What it is, where it pays off first, and how we guide you to value.
-
EI turns raw instrument data into signed, explainable results and connects them into one trusted intelligence across your lab and pipeline. EI Flow makes the call on every run, automating in-batch decisions into signed, audit-ready reports, so analysts review only the exceptions. EI Signal reads across instruments, methods, and sites to surface drift and emerging risk before it reaches release. Both are scientist-trained, SOP-aware, LIMS-integrated, and regulatory-grade, with your scientists in the loop and in control.
-
Where manual review bottlenecks release or creates rework. The fastest wins are high-volume, SOP-defined workflows: QC batch release, stability, DMPK and bioanalysis, and method transfer. We help pinpoint the bottleneck slowing your pipeline most, quantify the lift, and prove it on one method, expect faster cycles, fewer errors, and lower cost per result, with every decision signed and audit-ready.
-
We run a short method-selection session with your team and choose one high-volume, well-specified batch method. Examples include an LC or GC-MS quant panel, an HPLC release method, or a GC-FID authenticity check. Deliverables include acceptance criteria, data connectors, and a validation plan.
-
Phase 1: connect instruments and LIMS.
Phase 2: configure and validate side by side against your SOP.
Phase 3: go live with review-by-exception. Expected outcomes include minutes from batch to signed report, fewer manual errors, audit-ready records, and a clear expansion roadmap. We provide hands-on enablement and change-control templates. -
Yes. EI is instrument-agnostic and works with your existing fleet. It sits between your instruments and your LIMS or ELN, ingesting raw instrument output and pushing signed, audit-ready results to your records system. Deploy in the cloud for speed, on-premises for data residency or low latency, or hybrid, and your data never has to leave the environment it was generated in.
-
Analysts stay in control. EI uses review-by-exception: routine batches auto-sign when criteria are met, and low-confidence or rule-triggered items route to humans. Your confirmations feed back to improve future calls. We train teams and tune thresholds with you.
-
The Limited Sample Model (LSM) is EI's proprietary architecture, built for the reality of regulated labs: scarce data and decisions that have to hold up. Where most AI needs mountains of data, LSM reaches expert-grade accuracy from as few as 30 to 50 expert-reviewed examples. It learns from instrument data, not language, capturing your scientists' own decision logic, SOPs, and thresholds, so it stays grounded and never hallucinates. When confidence runs low, it routes to your experts instead of guessing, and every correction sharpens it through active learning. The result is production-grade AI you can stand up fast, that improves with use, and that becomes your institutional IP, accurate, traceable, and regulatory-grade.
-
Every model, rule set, and SOP configuration is versioned. Changes go through a controlled workflow: proposed updates are validated side-by-side against the current version, require designated approver sign-off, and are logged with who changed what, when, and why. Any version can be rolled back instantly without disrupting in-flight batches. Audit logs and change histories are exportable for QA review and regulatory inspection.
Can’t find the answer you’re looking for?
Set up a live demo to see EI in action end-to-end—with explainable decisions and signed, traceable reports. We’ll show how it fits your instruments & LIMS, and outline a 90-day path from first method to go-live.
Bring AI
to your lab
A hands-on working session that teaches the fundamentals, maps your first high-value batch method, and ends with a personalized playbook and method activtion.
Level up the team: Scientist-trained AI for analytical labs learn from limited, instrument-level data.
Map your first batch: define instruments, signals, acceptance criteria, and how results flow into LIMS.
Leave with a plan: a personalized AI-for-the-Lab playbook plus a 60–90 day Pilot MVP Candidate with milestones and expected outcomes.